import matplotlib.pyplot as plt
import numpy as np
fig,ax = plt.subplots() # 包含axes的figure
ax.plot([1,2,3,4],[1,4,3,2])

matplotlib.pyplot可以直接在當前axes上繪制圖像,如果用戶未指定axes,matplotlib會自動創建一個
plt.plot([1,2,3,4],[1,4,3,2])
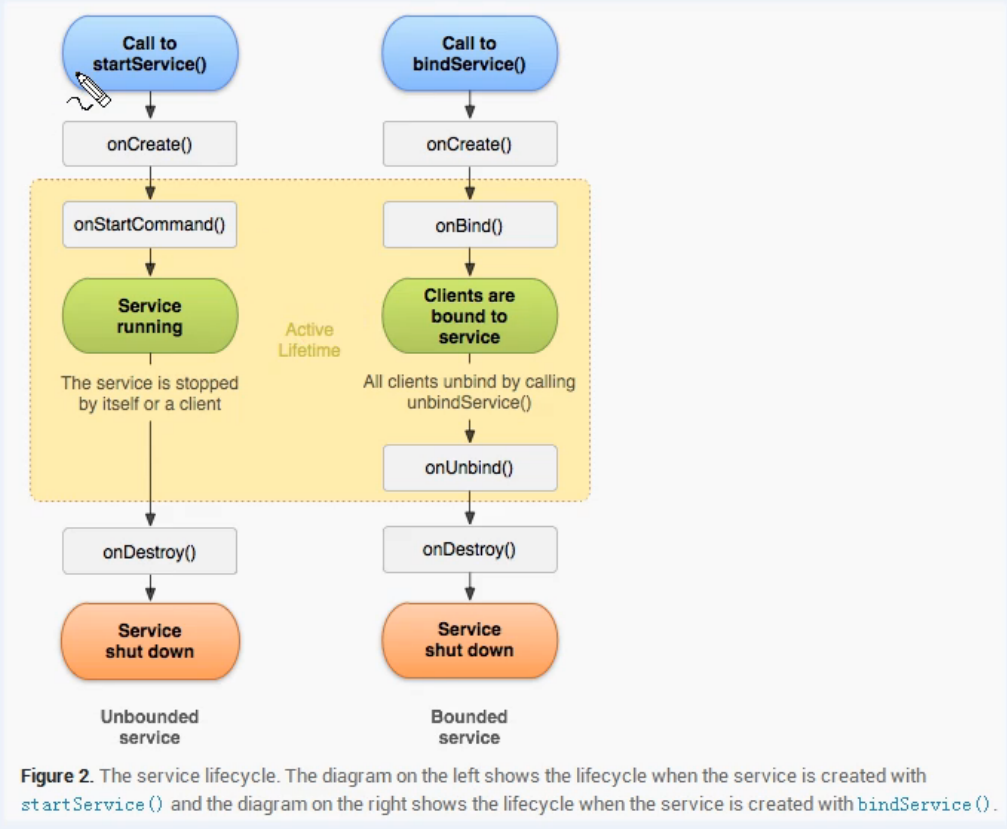
 在matplotlib中,圖像是由不同元素組成的,通常圖像是一個包含四個層次的容器:
x = np.linspace(0,2,100)
fig, ax = plt.subplots()
ax.plot(x,x,label='linear')
ax.plot(x,x**2,label='quadratic')
ax.plot(x,x**3,label='cubic')
ax.set_xlabel('x label')
ax.set_ylabel('y label')
ax.set_title('Simple Plot')
ax.legend()

x = np.linspace(0,2,100)plt.plot(x,x,label='linear')
plt.plot(x,x**2,label='quadratic')
plt.plot(x,x**3,label='cubic')
plt.xlabel('x label')plt.ylabel('y label')
plt.title('Simple plot')
plt.legend()
 作業
作業
你在工作或學習中通常何時會用到數據可視化,希望通過可視化達到什么目的?
matplotlib文檔、寫作業,數據直觀好看
版权声明:本站所有资料均为网友推荐收集整理而来,仅供学习和研究交流使用。

工作时间:8:00-18:00
客服电话
电子邮件
admin@qq.com
扫码二维码
获取最新动态


![[Python爬虫] 之二十七:Selenium +phantomjs 利用 pyquery抓取今日头条视频](https://images2015.cnblogs.com/blog/194720/201706/194720-20170623152154132-1614505015.png)